Why Does My GPU Utilization Keep Dipping?
/ 9 min read
Table of Contents
I ran into this question while building CreSTAL. As we write the research paper, I’m publishing some of the debugging work that sits behind it. An agent with access to my repo helped trace the training loop, and I used Claude Fable to turn that conversation and my GPU telemetry into this account.
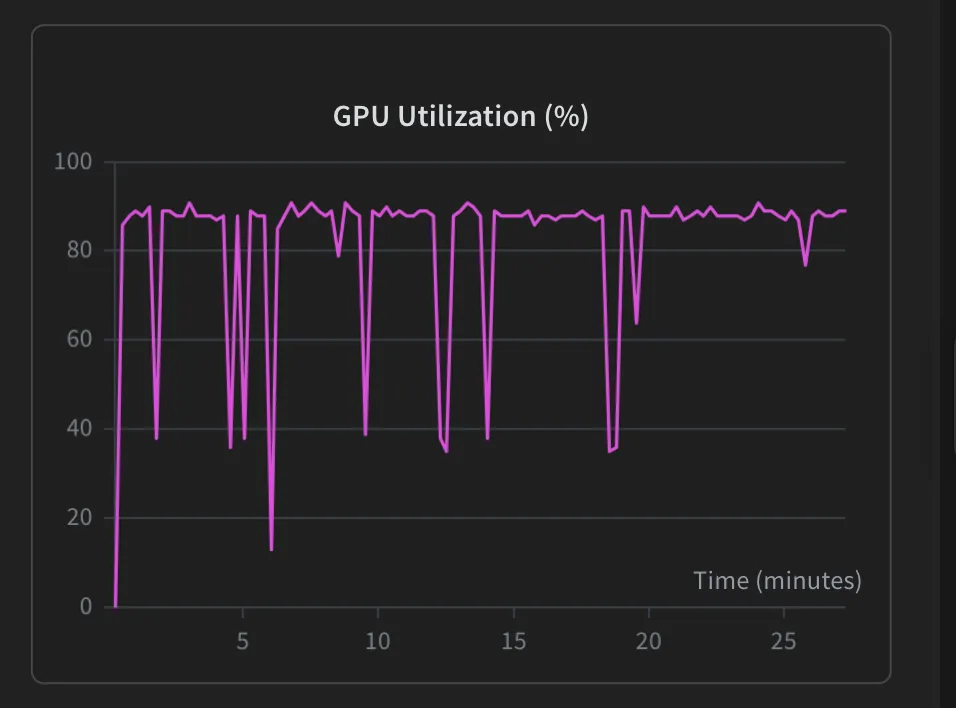
TL;DR: My colocated GRPO runs produce a sawtooth GPU-utilization trace: ~90% for a stretch, then sharp dips to 13–40%, over and over, plus occasional spikes in time-spent-accessing-memory. I confidently diagnosed a “periodic data-transfer bottleneck,” with vLLM handing tensors off to my GNN reward workers. A coding agent with repo access checked that story and returned “partially correct,” which is the polite AI way of saying the graph is real but your mechanism is fiction.
The dips expose GRPO’s phase cycle: vLLM decode, CPU parsing and GNN reward scoring, a cross-rank gather that waits on the slowest straggler, then the HF forward/backward pass and a weight sync into vLLM. Nothing hands tensors from vLLM to the GNN workers; vLLM outputs text. When all of this work shares the same GPUs, the utilization trace shows the training loop’s phases taking turns.
The setup
Same pipeline as the last two posts, but this time nothing is broken. I was just finally looking at the hardware telemetry. One node, four H100s. Each rank runs three tenants on its GPU: the GRPO trainer with the DDP policy model, a colocated vLLM engine capped at 30% GPU memory (TRL’s colocate mode), and two “modification workers,” GNN surrogates that execute each proposed materials modification and score the resulting property. 32 completions per prompt.
I had three graphs to explain:
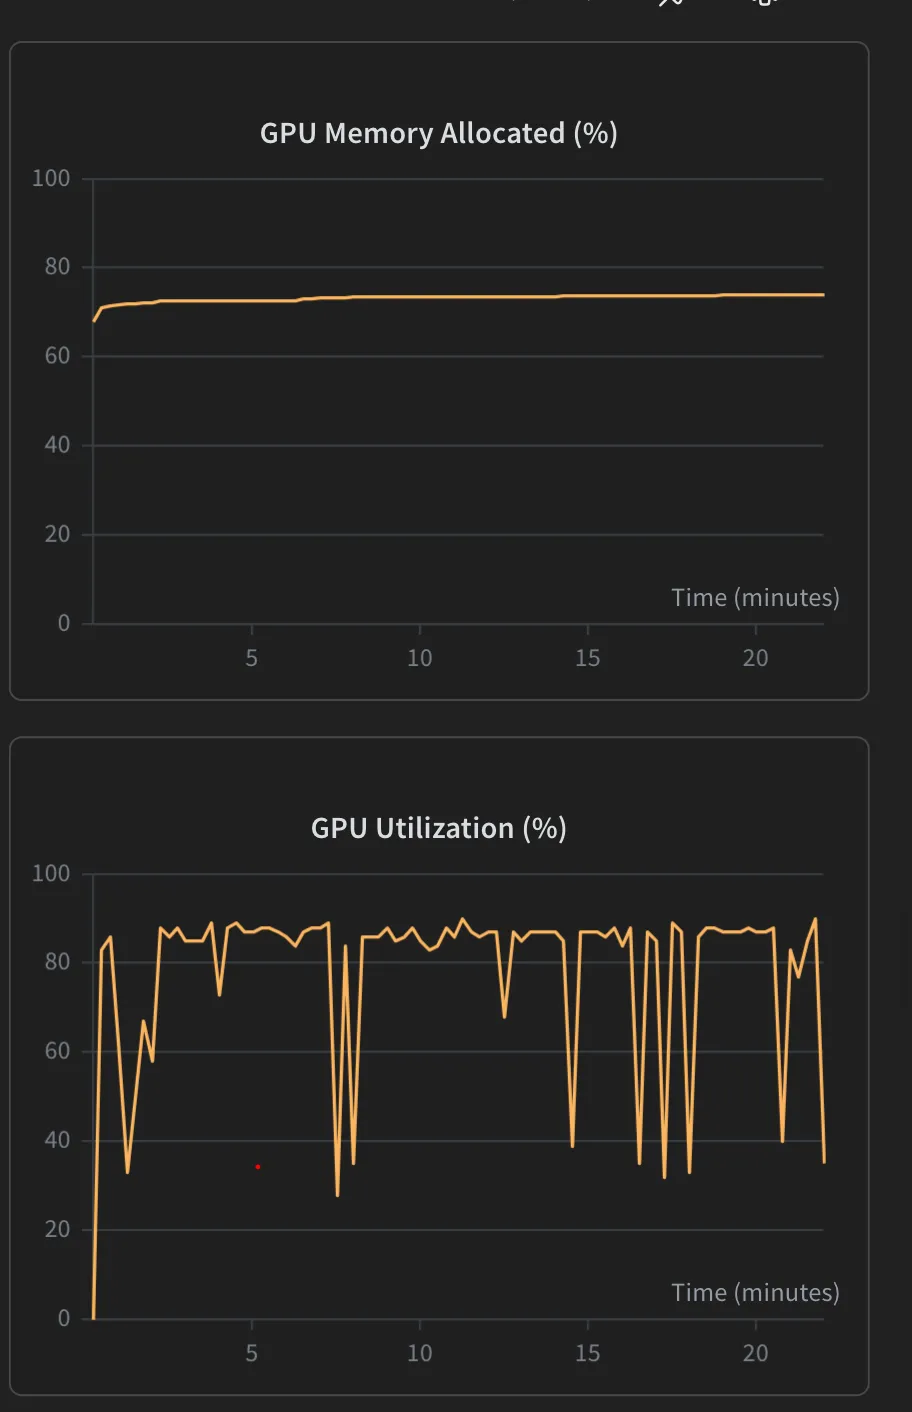
- GPU memory allocated: dead flat at ~73%. Three tenants, one GPU, everyone pre-allocated. Boring, which is what you want from a memory chart.
- GPU utilization: a sawtooth. Long stretches pinned at 85–91%, then sharp dips to 13–40%, recurring every one to four minutes, with the dips thinning out later in the run.
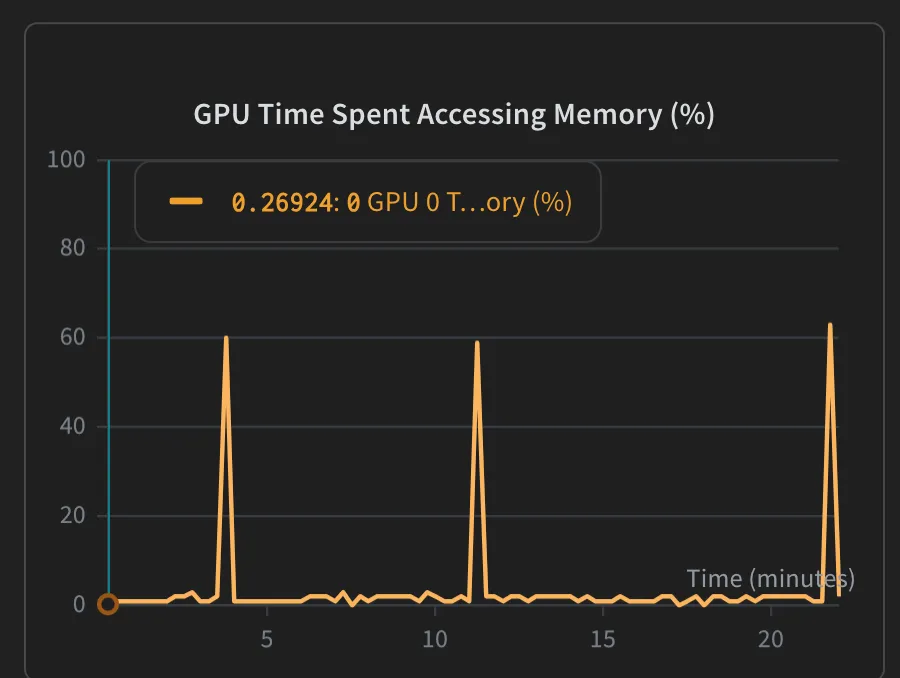
- GPU time spent accessing memory: near zero almost always, with isolated spikes to ~60% roughly every seven minutes.
My confident hypothesis
I wrote this at the time:
What you are seeing is a periodic data-transfer bottleneck. Most of the time, vLLM is happily generating tokens at 90% utilization. But periodically — likely when vLLM hands off data to the GNN workers, or when the GNN workers run their property improvements and synchronize — a large amount of data has to be moved in memory. During these split seconds, the GPU gets bogged down moving memory around, which forces the compute cores to pause and wait.
It has everything a good performance story needs: a villain (data movement), a mechanism (the handoff), and a perfect fit to the graphs. Before putting it in my notes as fact, I asked an agent with the repo checked out to trace the actual step and tell me if I was right.
The verdict: “partially correct”
The periodicity and the dips were real. Nearly every mechanism I named was wrong. What a GRPO step in this pipeline actually does is a sequential four-phase loop, and the utilization trace is just those phases taking turns:
Phase 1: decode (the ~90% plateau). vLLM chews through a 32-completion batch. Autoregressive decode is compute-heavy and long-running; utilization pins high. This is most of the wall clock, which is why the trace is mostly plateau.
Phase 2: reward scoring (the dips begin). The completions leave vLLM as text, not tensors. The reward function parses the XML on CPU, converts structures to ASE atoms, and ships them to the modification workers over a process pool with pickle IPC. The GNN property predictions do run on the same GPU, but they’re small, bursty models that don’t saturate the SMs. Utilization dips not because the GPU is “bogged down moving memory,” but because the work changed shape: from a dense decode batch to CPU parsing punctuated by lightweight GNN inference.
Phase 3: the gather (the dips deepen). Four ranks reach a collective gather of rewards, and every rank waits for whichever GNN job is slowest anywhere on the node. That’s idle-by-synchronization: three GPUs sitting idle because a fourth is still relaxing a crystal structure.
Phase 4: train and sync. The HF policy runs forward/backward, the LoRA update lands, and TRL syncs the updated weights back into the colocated vLLM engine so the next batch is generated by the current policy. This is the one place in the loop where a genuinely large memory move happens on schedule. It’s the closest thing to my “data transfer” villain, except it’s weight traffic, not structure handoff.
The scorecard on my original story:
| My claim | Verdict |
|---|---|
| Periodic bottleneck tied to the step cycle | Yes. Generate → reward → gather → train, repeating |
| vLLM at ~90% during generation | Yes |
| Dips when generation ends | Yes. Reward scoring, gather stragglers, training |
| ”vLLM hands off data to GNN workers” | No. vLLM outputs text; the pool gets ASE structures via CPU pickle |
| ”GNN workers synchronize” causes dips | Partially. The workers are async pool jobs; the real sync is the cross-rank gather |
| ”Large memory moves force compute to pause” | Partially. Real memory pressure exists (three tenants, 73% allocated), but the structure IPC is CPU-side, and weight sync is the better memory story |
This is the corrected sequence:
The memory-access spikes are still unconfirmed. Weight sync and cache management are the leading suspects, but the cadence (~7 minutes) doesn’t cleanly match either, and I refuse to get fooled by a plausible story twice in one debugging session. I need to correlate the spikes against step boundaries in the training logs before believing either explanation.
How to check your own sawtooth
If your colocated GRPO trace looks like mine, four checks turn vibes into facts:
- Align the dips with step boundaries. Plot
global_steporstep_timefrom your training logs against the utilization trace. If dips land on phase transitions, it’s anatomy, not pathology. - Break down time per phase. TRL already wraps generation, reward computation, and training in profiling contexts, so compare where the seconds actually go before optimizing anything.
- Correlate memory spikes with named events. Weight syncs, checkpoint saves, and cache clears each have a schedule. A spike that doesn’t match any schedule is the only one worth chasing.
- Check dip depth against the slowest worker. On multi-GPU runs, if deeper dips track the longest reward job in the batch, your cost center is the straggler, not the GPU.
Takeaways
-
Colocation makes every phase transition visible. Trainer, vLLM, and reward workers take turns on the same silicon, so each handoff shows up as a dip. Ask which phase is the longest, and whether that’s the one you’re paying for.
-
A utilization dip is not automatically a bottleneck. vLLM idling while rewards compute is the design of the loop. The optimization target is phase duration (faster reward scoring, fewer stragglers), not dip elimination.
-
Plausible is not correct. My story fit every pixel of the graphs and misidentified the mechanism at every step: the payload (text, not tensors), the location (CPU pickle, not GPU memory), and the synchronization (cross-rank gather, not worker handoff). A graph can’t arbitrate between two stories that fit it equally well, so go read the code.
-
Take the “partially correct.” The agent kept what the graphs supported (real periodicity, real dips, real memory pressure) and replaced my guessed mechanisms with ones traced through the code. The previous posts applied that discipline to broken runs. This time the run was fine; only my explanation was broken, and explanations are cheaper to fix before they reach a paper.
References
- TRL docs — vLLM integration: colocate mode and weight syncing
- Why is my GRPO Loss 0? — same pipeline, when the run actually was broken
- Why Is My Model Suddenly Speaking Thai? — same pipeline, when the tokenizer was the villain